Linear Least Squares on NOAA Daily Temperature Data 1930-2018
Introduction
Some months back, an interesting video popped up in my YouTube recommendations. The title was something like "Why Global Warming is a Hoax", from an obvious climate-change skeptic. I laughed out loud, thinking everyone knows that's hogwash and global warming is a real human-influenced phenomenon. I decided to watch the video, just to hear the arguments and hopefully have a good laugh. But that wasn't what happened at all. The video presented many sound, logical arguments backed up by actual data. I watched a few more of Tony Heller's videos, which significantly altered my view of the whole climate change debate.
In the spirit of Tony's videos, and not taking popular media hype or his conclusions at face value, I decided to do some data analysis of my own.
My approach centers on applying linear least squares (linear regression) to NOAA daily temperature data, then averaging, comparing, and contrasting the slopes of those lines for various stations and time periods. I used Ubuntu for Windows (a.k.a Windows Subsystem for Linux WSL) (bash, grep, sed, awk, sort, etc.), Gnuplot, LibreOffice, and custom C code to reduce and analyze the data.
I'm not immediately interested in trying to incorporate data from stations that came online recently. I think that's just asking for consistency problems. I'm much more interested in analyzing continuous data from stations that have been online for longer than the relatively short-term trends that are frequently reported.
Downloading NOAA Daily Data
# download daily noaa data by year, 13GB compressed
for x in {1930..2018}; do
    echo "downloading year $x"
    wget -c --limit-rate=100k https://www1.ncdc.noaa.gov/pub/data/ghcn/daily/by_year/$x.csv.gz
    mv $x.csv.gz original/
done
Reduce Original Data to TMAX/TMIN Entries
This reduces the total data set to just TMAX (daily maximum temperature) and TMIN (daily minimum temperature) data entries.
# reduce original data to TMAX and TMIN entries, omitting other types of entries, 4.2GB compressed
for x in {1930..2018}; do
    gunzip -c original/$x.csv.gz | grep "TMAX\|TMIN" | gzip -c > tmax/$x-tmax.csv.gz
done
Determine Stations Common to 1930 and 2018
# determine stations common to 1930 and 2018 from TMAX/TMIN entries
gunzip -c tmax/1930-tmax.csv.gz | sed 's/,/ /g' | awk '{print $1}' | sort -u > stations-tmax-1930.txt
gunzip -c tmax/2018-tmax.csv.gz | sed 's/,/ /g' | awk '{print $1}' | sort -u > stations-tmax-2018.txt
for x in `cat stations-tmax-1930.txt`; do
    grep $x stations-tmax-2018.txt
done > stations-tmax-common.txt
Reduce TMAX/TMIN Data to Common Stations
# reduce TMAX/TMIN data to common stations, 733MB compressed
# distributed over 8 terminals to use more cpus
for x in {1930..2018}; do
    gunzip -c tmax/$x-tmax.csv.gz | grep -f stations-tmax-common.txt | gzip -c > common-tmax/$x-common-tmax.csv.gz
done
Reorganize Data Into Per-Station Files
# reorganize/decompress data into per-station files for calculating stats and making plots, 1.8GB uncompressed
for s in `cat stations-tmax-common.txt`; do
    for x in {1930..2018}; do
        gunzip -c common-tmax/$x-common-tmax.csv.gz | grep $s | grep TMAX
    done > station-tmax/$s-tmax.csv
done
for s in `cat stations-tmax-common.txt`; do
    for x in {1930..2018}; do
        gunzip -c common-tmax/$x-common-tmax.csv.gz | grep $s | grep TMIN
    done > station-tmin/$s-tmin.csv
done
Remove Stations Missing Lots of Data
This left me with around 1600 stations with near continuous 1930-2018 daily temperature data. The stations are in many parts of the world, but I have not mapped or calculated geographic distribution.
# remove small station files missing lots of data, we want stations with mostly continuous 1930-2018 data
find station-tmax -name "*.csv" -size -1000000c -delete
find station-tmin -name "*.csv" -size -1000000c -delete
Linear Regression Source Code
I wrote a small program to read the station data files and compute linear least squares stats. Basically, this fits a y = a * x + b line to the data. Fits are calculated for the whole data set, the first half of the data set, and the second half of the data set.
linreg.c
Perform Linear Regressions
Here are linreg-tmax.csv and linreg-tmin.csv.
# perform linear regressions, 600KB uncompressed
for x in station-tmax/*.csv; do
    ./linreg $x
done | sort -u > linreg-tmax.csv
for x in station-tmin/*.csv; do
    ./linreg $x
done | sort -u > linreg-tmin.csv
Some Example Plots
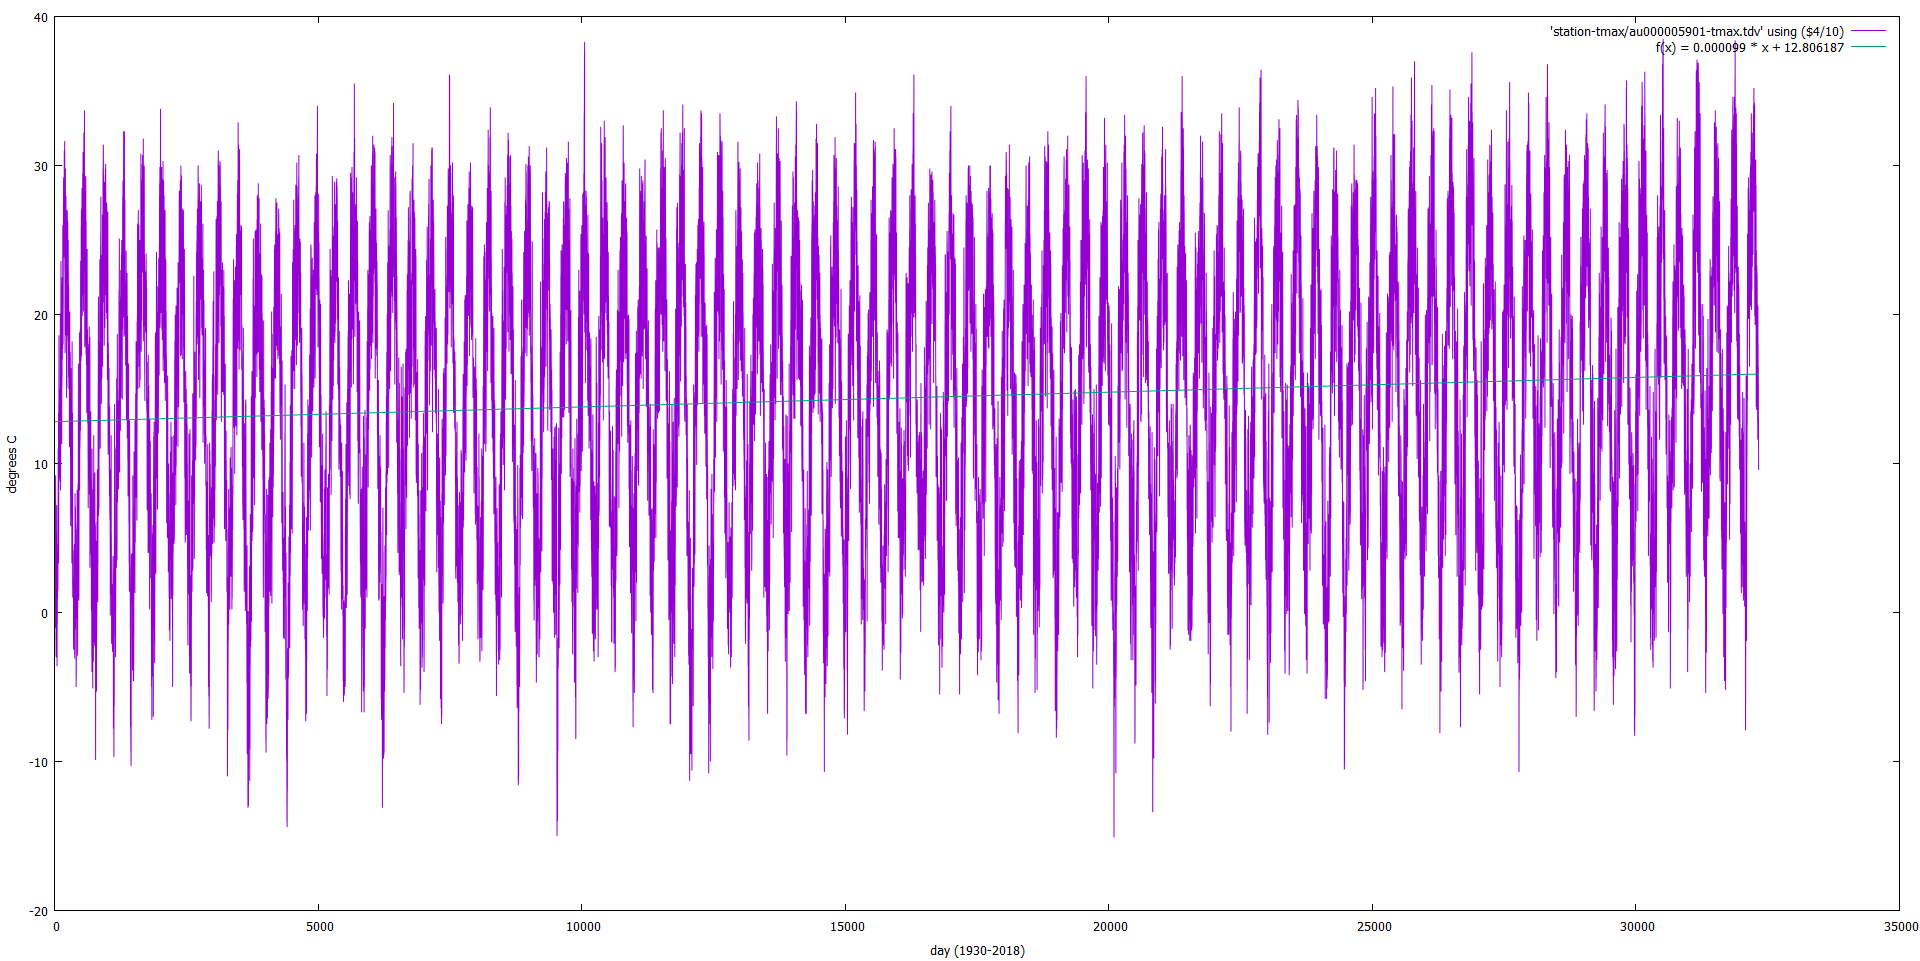
This shows a station TMAX with positive slope.
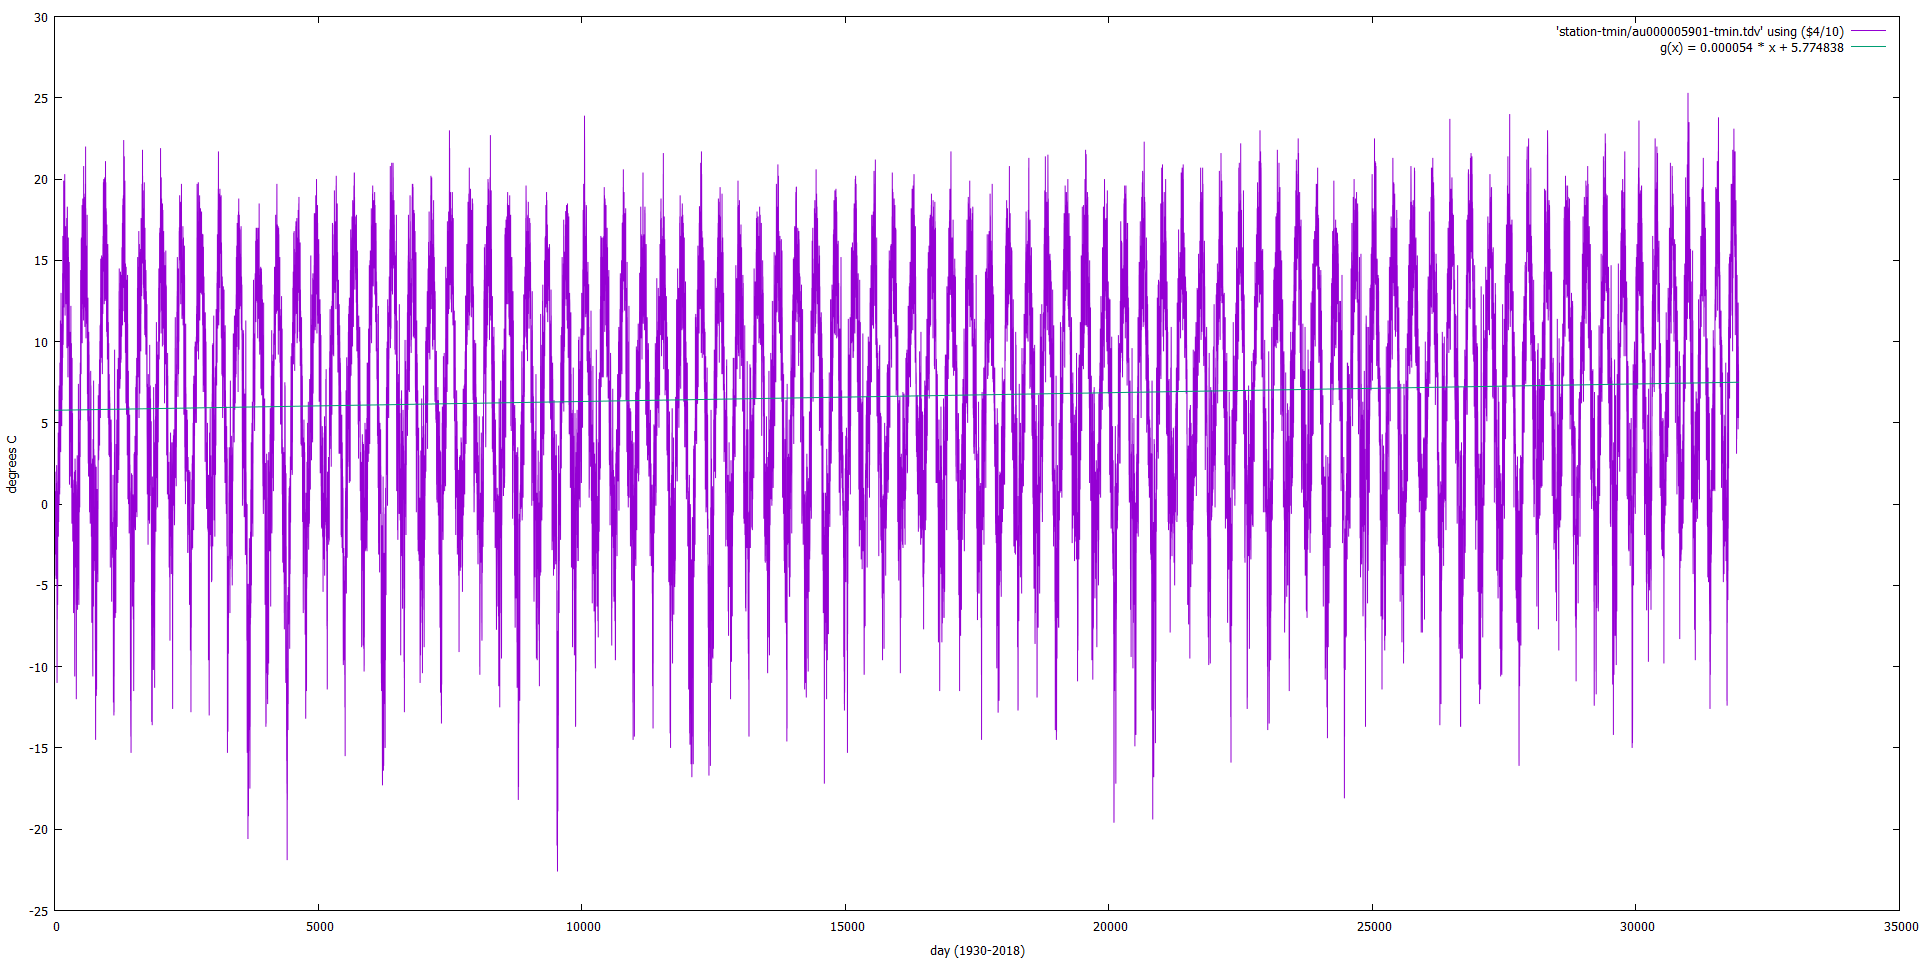
This shows the same station TMIN, which also has positive slope.
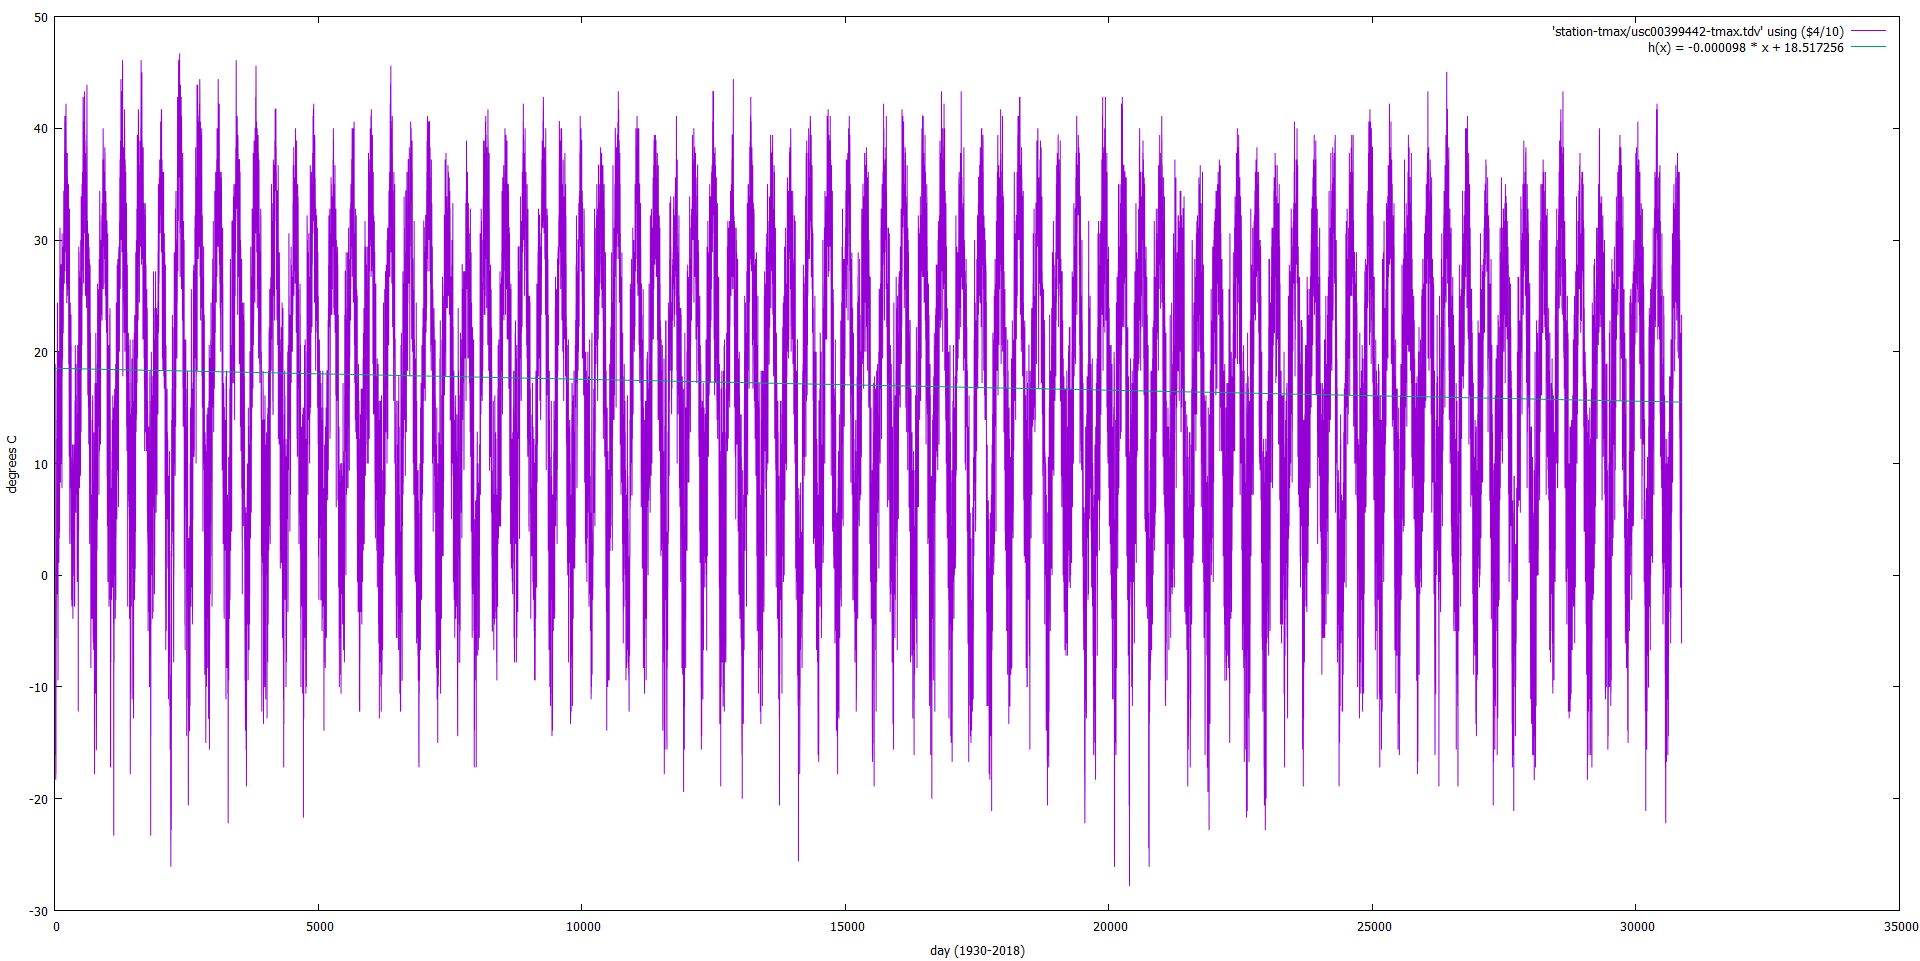
This shows a station TMAX with negative slope.
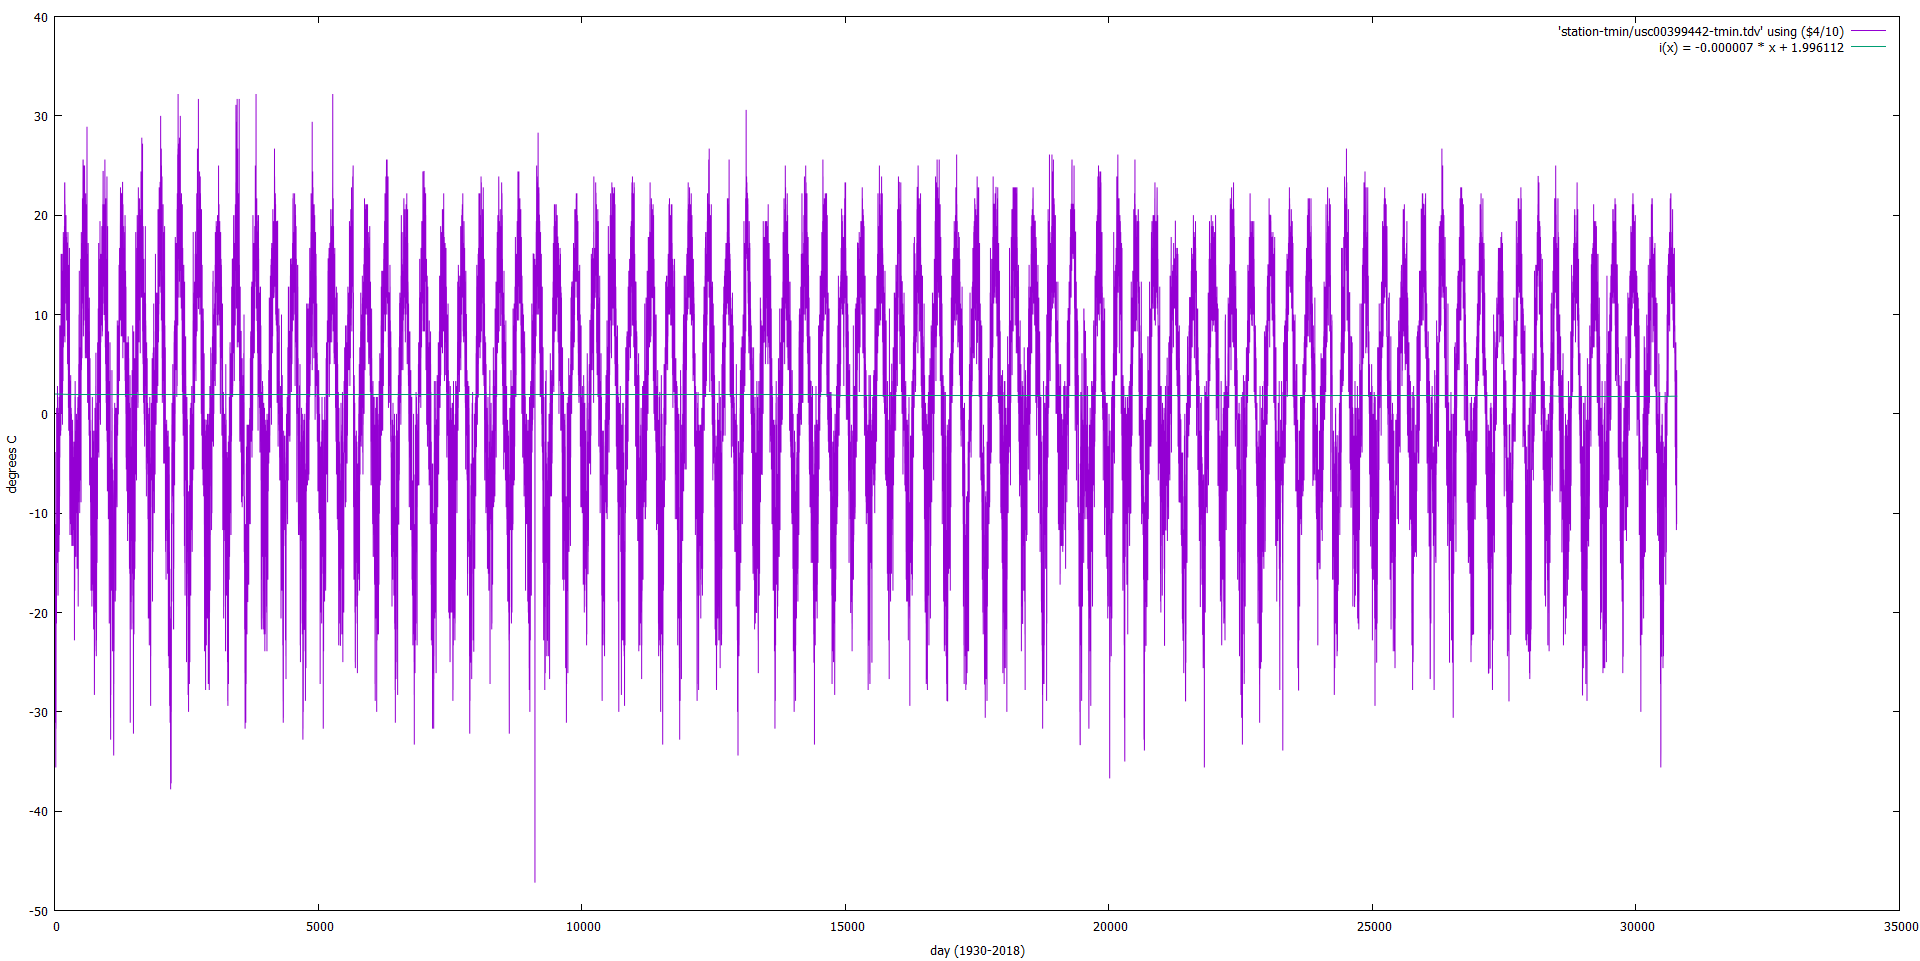
This shows the same station TMIN, which also has negative slope.
Making Sense of Tons of Slopes
The calculated line slopes have units of degrees C per day. I averaged similar slopes from the linreg program output in a LibreOffice Calc spreadsheet. There were an average of 30956.789 days included in each overall linear regression, half of that for the first half or second half. Here are the average slopes:
| a overall | a first half | a second half |
| TMAX | 3.75859912445283E-07 | -5.20531582238898E-05 | 5.57460913070669E-05 |
| TMIN | 2.72875902823374E-05 | -2.92265265922521E-05 | 8.45298752462246E-05 |
Discussion
Is my analysis perfect? No, definitely not. There are problems with the data and my analysis, but there is enough here to draw some rough conclusions and to ask some interesting questions.
First, based on this analysis, both climate change and global warming are real, but the magnitudes are a bit less than what is frequently reported in popular media. The average overall linear regression slopes are positive for both daily TMAX and daily TMIN data sets, but the magnitudes are significantly different.
Second, TMIN (daily minimum temperature) seems to have a higher average overall positive slope than TMAX, by almost two orders of magnitude, so I'd argue that TMIN might be a more important individual statistic than TMAX or percentage of days over some temperature. Ideally, we'd have high-frequency measurements (like 1/min) to calculate per-day average temperature, but that data does not exist historically. TMAX and TMIN alone do not tell us anything about how much time was spent at those temperatures during the day. Maybe we could develop some models to estimate average daily temperature based on TMAX, TMIN, latitude, and date, but I have not researched that yet.
Third, 1930-1974 generally experienced a global cooling period and 1974-2018 generally experienced a global warming period. The average first half slopes are negative, which indicates a cooling trend. The average second half slopes are positive, which indicates a warming trend. This analysis corroborates points made in some of Tony Heller's videos.
Fourth, if CO2 emissions have been steadily increasing during the 1930-2018 period, and if CO2 concentration in the atmosphere has been steadily increasing during the 1930-2018 period, and if increasing CO2 concentration in the atmosphere causes global warming, how can we account for the general cooling trend during the 1930-1974 period? This is definitely a fly in the ointment for the CO2 emission guilt peddlers. Do I think we, as a species, are doing dangerous experiments and doing damage to the environment? Yes. Do I think CO2 emissions are the primary factor in climate change? No, I haven't seen enough data to support that yet.
The only way I can make sense of the 1930-1974 cooling trend is if CO2 emissions are not the primary driver for climate change. Whatever heavily influenced that period must have had an effect orders of magnitude greater than the effect from CO2, if there is an effect from CO2. Short of that, there could be some effect from the non-uniform geographical distribution of the stations included in this analysis, but I think the sheer number of stations included makes that an unlikely source for the cooling trend.
These results are not cut and dry, but this analysis was definitely interesting.
Interesting Discussion 2/15/2019
While discussing these results, a friend suggested that SO2 might account for the temperature decrease from the 1930s to the 1970s. Smog regulations may have cleaned up the air, resulting in less reflected sunglight and a trend correction from the 1970s to now. That was a very interesting suggestion. After some quick searching, I'm having trouble finding SO2 data from before the 1970s. So, I'd need to do more searching to really comment on that.
Another suggestion was that atmospheric methane absorbtion might have a significant effect. I have not made time to overlay the various absorbtion spectra, but I'm curious to take a closer look at how the various spectra overlap.